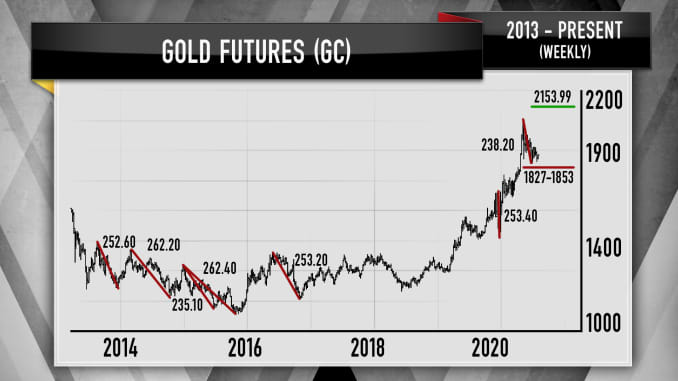
- “The charts, as interpreted by Carolyn Boroden, suggest that gold prices could have a lot more room to run and that certainly fits with the current backdrop that we see in the news,” CNBC’s Jim Cramer said.
- Trading patterns in the gold futures are showing “exactly what you ant to see in a chart,” the “Mad Money” host said.
- After reviewing chart analysis from Boroden, a commodities expert, he suggested that bullion, the SPDR Gold Shares, or GLD, exchange-traded fund and Barrick Gold are ripe for holding.
Investors may have an opportune time to start a position on gold or gold securities as the precious metal could be on an upswing, CNBC’s Jim Cramer said Tuesday.
Gold investments can serve investors as insurance against inflation and general economic chaos, Cramer said.
Gold futures have risen about 25% year to date, and the price for the precious metal is down 8% from its peak close in early August. It rose about 17 points to $1,909.70 as of Tuesday afternoon.

While looking at the weekly chart of the continuous gold futures, Cramer noted that Boroden, who launched FibonacciQueen.com, forecasts that gold is still on a long-term uptrend as long as it stays above its September lows under $1,870.
The higher highs and higher lows is “exactly what you ant to see in a chart,” Cramer said.
“Clear these two hurdles, along with the October high at $1,939 … [it could] be really smooth sailing,” the host said. “As long as the precious metal hangs in above the mid-1800s, call her a buyer. I think she’s going to be dead right.”
As for Barrick Gold, shares of the Toronto-based company are within $3 of their September closing high. At $27.78, the stock is up almost 50% this year.
As for GLD, the ETF is within 15 points of its closing high in early August. The ETF is up 25% year to date.


