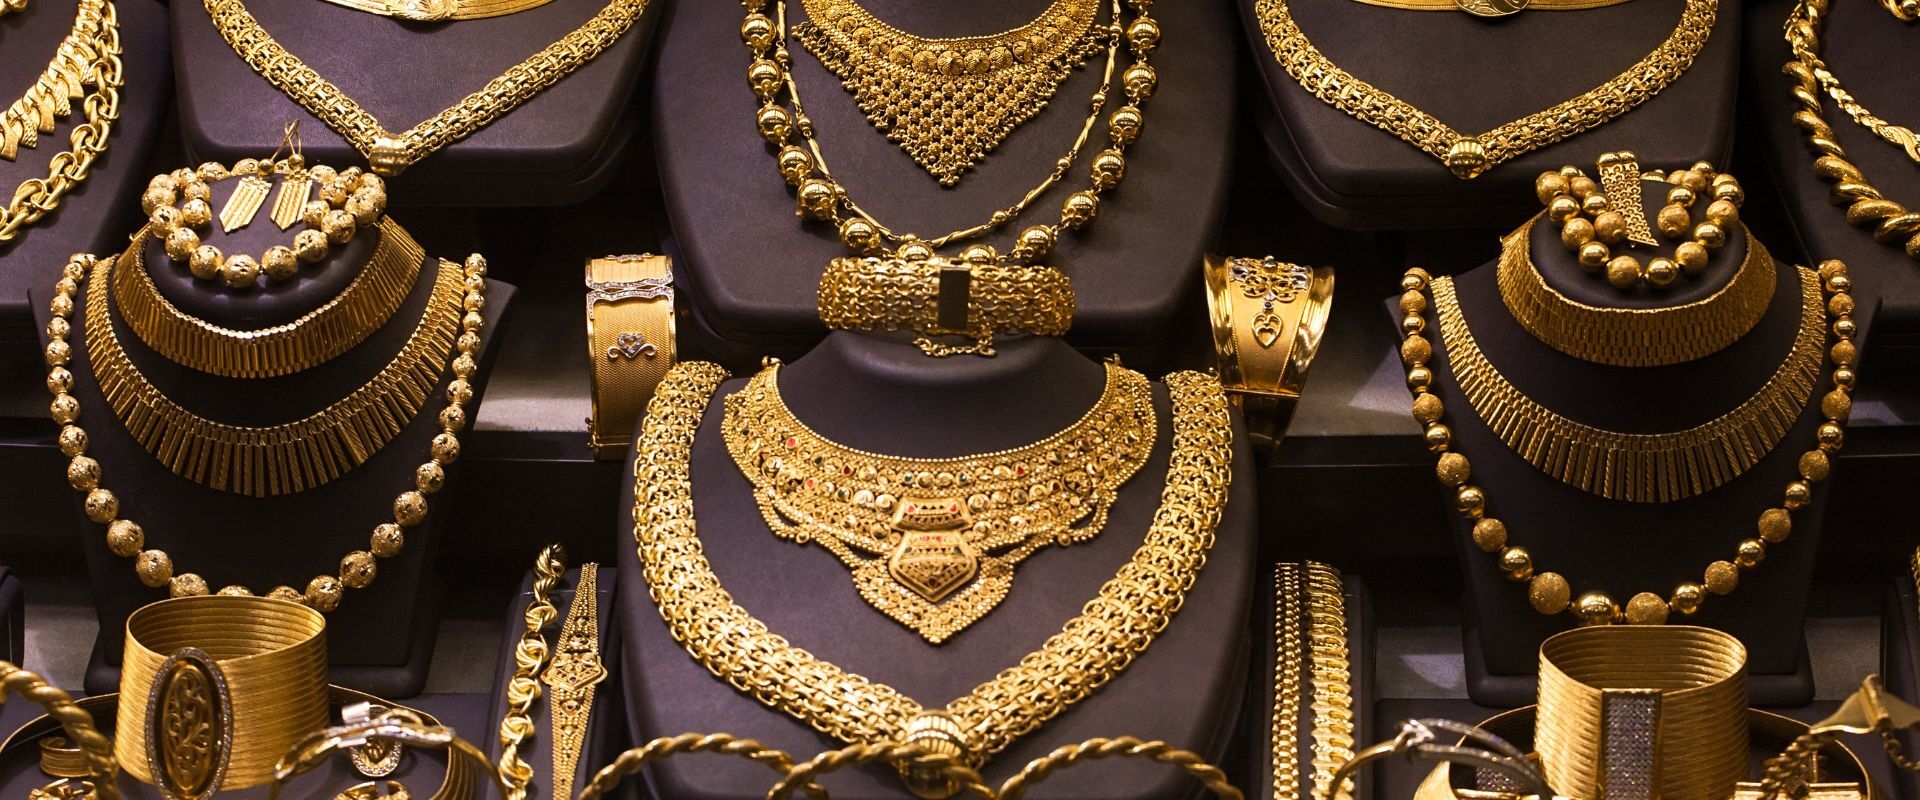
Jewelry accounts for about 50% of all gold demand per year, on average. Understanding the top buyers making up this sizable portion of gold demand can help traders better analyze key market conditions.
Each year, two nations typically reign supreme in terms of gold jewelry demand and consumption: India and China. Gold is deeply intertwined in Indian and Chinese cultures, playing a key role in various festive celebrations.
Entire holidays like Diwali in India revolve around bringing home good fortune through the purchases of precious. Numerous auspicious dates spike gold buying in India during the year as consumers purchase jewelry and gold gifts for investment and cultural purposes alike. Similarly, China cherishes gold during the Lunar New Year.
In 2019, China and India accounted for more than half (57%) of all gold jewelry consumption around the globe, with India ranking first at 136.6 tons consumed during the fourth quarter and China falling closely behind at 132.1 tons. The next closest nation was the United States, with only 34.8 tons of gold jewelry consumption in Q4 2019, then the United Arab Emirates at 11.5 tons. The list quickly diminishes from there, showing the stark contrast between India and China’s buying levels versus the rest of the world.
As gold prices elevate each year, some analysts expected to see India and China’s retail demand rates drop, but consumers continued flocking toward the precious metal. In 2022, both nations again ranked at the top of the list. India’s gold jewelry demand rates for 2022 amounted to a massive 600 tons, while China followed closely at 571 tons, with the U.S. coming in fourth place at 144 tons.
According to the World Gold Council, gold demand reached an 11-year high of 4,471 tons in 2022, which can likely explain the impressive figures stated above.
As we look at far more recent data, India and China remain the top two gold jewelry consumers by a landslide. In the second quarter of 2023, India consumed 128.6 tons of gold jewelry, representing an 8% decrease from the same quarter during 2022, likely because of record-high local prices dragging demand rates.
At the same time, though, China’s consumption rates during Q2 2023 reached 132.2 tons compared to 103.2 tons during Q2 2022, showing an impressive 28% year-on-year increase as the nation recovered from COVID-19 lockdowns. China’s jewelry consumption rates during the second quarter of this year lifted the total Q2 figure by 3% as it outweighed India’s weakness.
“In the context of the very high gold price environment, jewelry demand has been remarkably resilient so far this year. China’s recovery from the severe 2022 consumption drought goes some way towards explaining this buoyancy, as does the investment motive that helps to drive purchases in high-carat markets including Turkey and India,” the World Gold Council explained in its Q2 report.
In 2023’s third quarter, the trend reversed, with India’s consumption firming as China’s levels dropped. India’s jewelry demand rate in the third quarter of this year reached 155.7 tons, representing a 6% increase from the same quarter last year. India’s approaching its festive season, so analysts are expecting to see demand rates reach high points for the year.
“Jewellery fabrication jumped 9% y/y to 199t, the highest Q3 figure since 2015. Lower gold prices, continued retail network expansion, and the anticipation of a good wedding and festive season led to this jump, with retailers stocking up in preparation,” the World Gold Council explained.
“India’s outlook for the remainder of the year is healthy, although with an element of caution. The seasonal boost in festive and wedding purchases should help release pent-up demand, particularly after a relatively weak H1.”
China, on the other hand, experienced a 6% year-on-year decrease in gold jewelry consumption during Q3 2023. With that being said, “Y-t-d demand is 8% higher at 481t, an impressive performance in the face of a soaring local gold price. And thanks to the record-level quarterly average local gold price, 2023 saw the highest Q3 demand in value terms, totalling RMB71bn, or US$10bn,” the World Gold Council explained.
Additional nations with relatively high levels of gold jewelry consumption during the latest quarter included Turkey and the Middle East, with a regional 2% year-on-year increase.
According to a recent Market Research Report, the jewelry market in the Middle East and Africa is expected to grow from $33.14 billion in 2023 to $53.72 billion in 2030.
With nations like India and China continuing to support gold jewelry demand while the Middle East expands its retail buying amid rising infrastructural growth, gold enjoys sustained performance levels.


